Local Debugging
Debug your Edge Functions locally using Chrome DevTools for easy breakpoint debugging and code inspection.
Since v1.171.0 the Supabase CLI supports debugging Edge Functions via the v8 inspector protocol, allowing for debugging via Chrome DevTools and other Chromium-based browsers.
Inspect with Chrome Developer Tools
- Serve your functions in inspect mode. This will set a breakpoint at the first line to pause script execution before any code runs.
1supabase functions serve --inspect-mode brk
- In your Chrome browser navigate to
chrome://inspect. - Click the "Configure..." button to the right of the Discover network targets checkbox.
- In the Target discovery settings dialog box that opens, enter
127.0.0.1:8083in the blank space and click the "Done" button to exit the dialog box. - Click "Open dedicated DevTools for Node" to complete the preparation for debugging. The opened DevTools window will now listen to any incoming requests to edge-runtime.
- Send a request to your function running locally, e.g. via curl or Postman. The DevTools window will now pause script execution at first line.
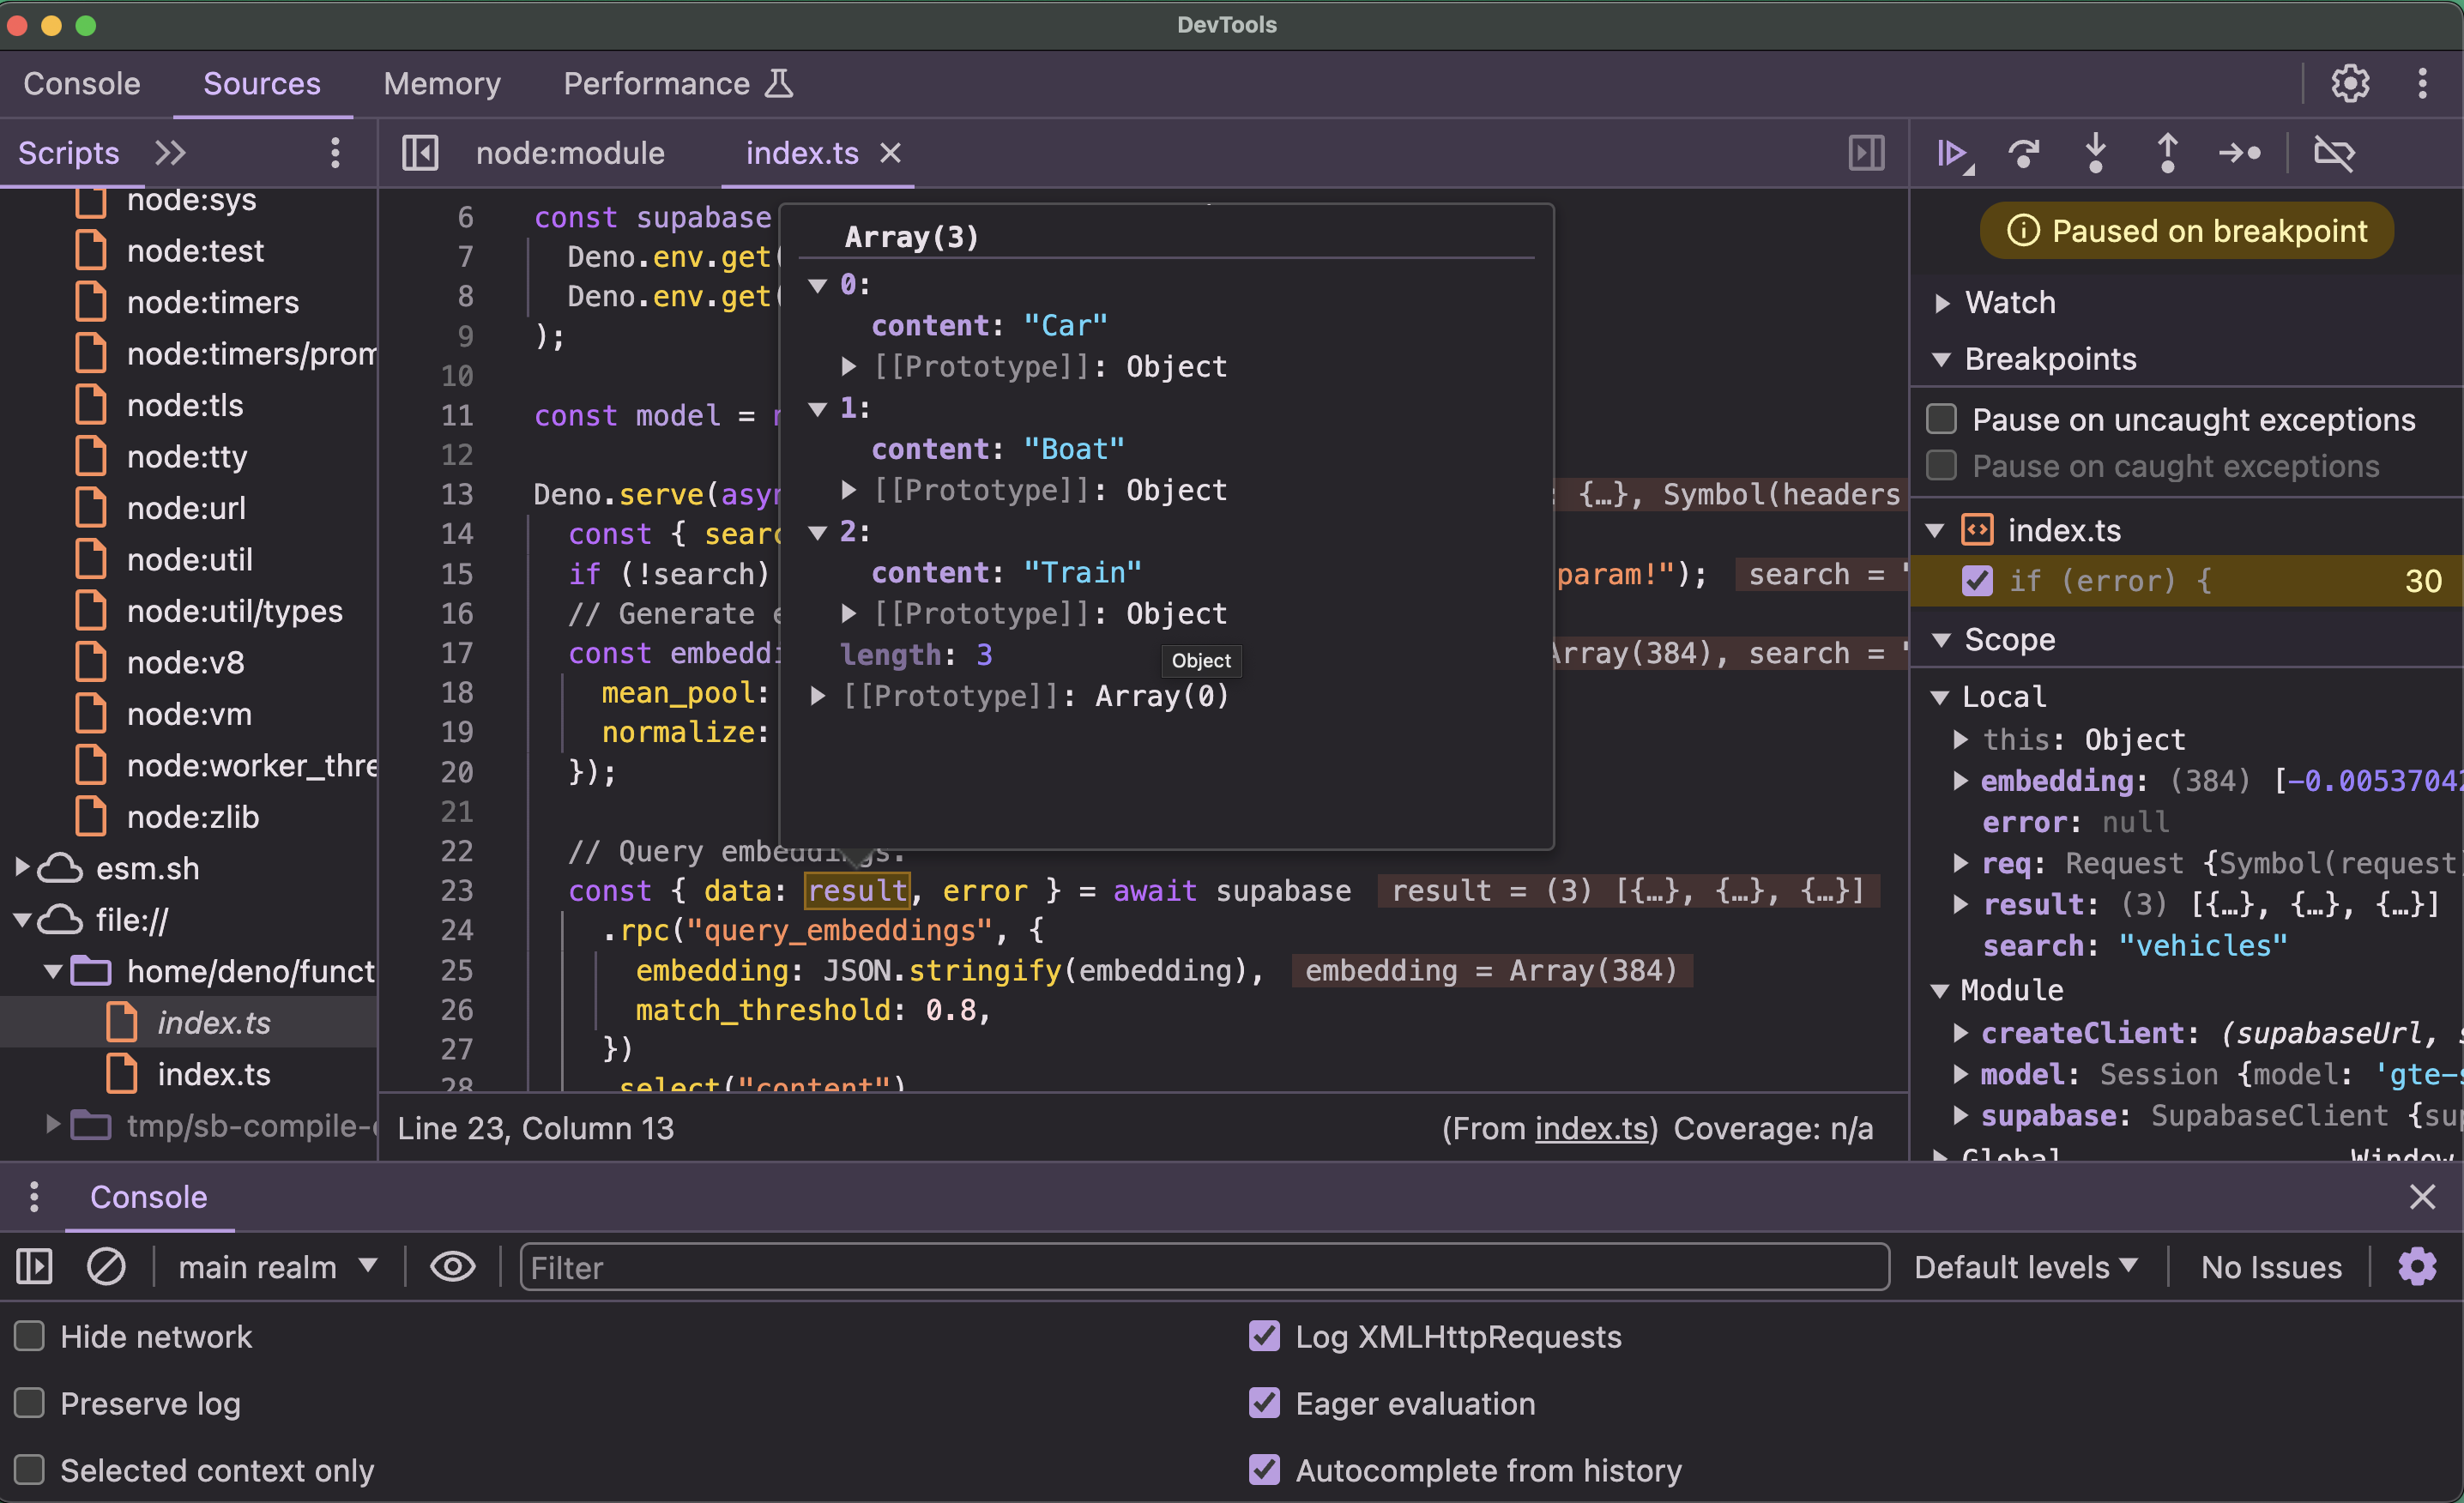
- In the "Sources" tab navigate to
file://>home/deno/functions/<your-function-name>/index.ts. - Use the DevTools to set breakpoints and inspect the execution of your Edge Function.
Now you should have Chrome DevTools configured and ready to debug your functions.